The Red Pee Proposition
Most parents have had the challenge of convincing their kids to eat vegetables.
"Try some brocolie, honey. It's good for you."
"Why?'"
"Because it's healthy. It gives you lots of vitamins and fiber."
" No, thanks." (Looking away)
This conversation I had with my kindergartener yesterday wasn't so typical.
"What is this red food?"
" It's called beet and it makes you red pee tomorrow if you eat enough."
"How many is enough?"
"20 little pieces, I guess."
"One, two, three... I got twenty!" (Chewing)
Get Inside of Your Audience's Mind
Much of a Product Manager’s responsibility is to juggle multiple streams of conversation and move them towards closure. As a PM, you're required to influence and sell on a daily basis, to different audiences. During a good portion of your day, you make data-driven decisions (hopefully) with your left brain. Is it good to extend that capacity and sell with evidence or on the technicality side of the story?It depends.
To an engineering audience, it may very well be the best way to go about it. At the meantime, you'd better be prepared to sharpen up your right brain in order to take on an audience made up of sales, design or anyone new to the technology or concept you introduce on.
How to Talk Tech to Non-Technical Audience
Live like an adult and think like a child - If you want to convince a child, you first learn how a child thinks.
The focus of the left brain is verbal, processing information in an analytical and sequential way, looking first at the pieces then putting them together to get the whole. The right brain of the brain focuses on the visual, and processes information in an intuitive and simultaneous way, looking first at the whole picture then the details. Left brain thinking is verbal and analytical. The right brain is non-verbal and intuitive, using pictures rather than words.
Case Study: Tell a Technical Story in the Language of your Audience
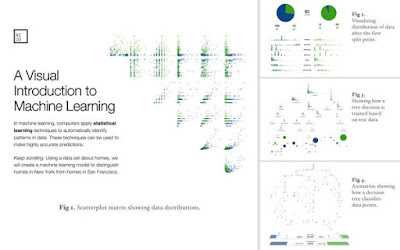
R2D3 is an experiment in expressing statistical thinking with interactive design. Using a data set about homes, they created a machine learning model to distinguish homes in New York from homes in San Francisco. This is the most powerful visual storytelling I've come across recently. How elegant!
SCROLL
Immerse yourself in the data story
This is part 2 of story telling series. Find part 1 there.
Follow me on twitter (@qindizhang) or add me to your Google+ circle, my friend! Let me know in the comment what other topics you want to read about!

No comments:
Post a Comment